Data Analytics with Python (Bootcamp Program)
Python Libraries for Data Analytics: Python provides numerous libraries that can be used for data analytics, including NumPy, Pandas, Matplotlib, and Seaborn.NumPy is a library that provides support for large, multi-dimensional arrays and matrices. It is useful for performing mathematical operations on these arrays and matrices. NumPy also provides a number of functions for numerical analysis, including Fourier transforms, linear algebra operations, and random number generation.

Pandas: Pandas is a library that provides high-level data structures and functions designed for working with tabular or structured data. It is useful for data cleaning, data exploration, and data manipulation. Pandas allows users to work with data in a variety of formats, including CSV, Excel, and SQL databases.
Matplotlib: Matplotlib is a library that provides support for creating data visualizations, including line plots, scatter plots, and histograms. It is useful for exploring data and communicating insights to stakeholders. Matplotlib is highly customizable and can be used to create publication-quality figures.
Seaborn : Provides high level eye catching Interface for informative statistical graphics.
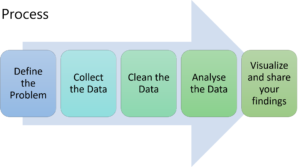
Data Analytics Process: The process using Python can be broken down into several steps:
1. Data collection: Collecting data from various sources, including databases, spreadsheets, and APIs.
2. Data cleaning: Cleaning and preparing the data for analysis, including removing missing values, handling outliers, and converting data types.
3. Data exploration: Exploring the data using statistical techniques and data visualization to identify patterns and relationships.

4. Feature engineering: Creating new features from existing data or selecting the most relevant features for analysis.
Examples
The scope of data analytics is vast and diverse, as it involves the use of various techniques and tools to extract valuable insights from data. Some of the main areas of data analytics include:
Descriptive Analytics: Descriptive analytics involves the use of data to understand what happened in the past. It is used to summarize and describe the characteristics of data and identify patterns and trends.
Diagnostic Analytics: Diagnostic analytics involves the use of data to understand why something happened. It is used to identify the root cause of a problem or a particular outcome.
Predictive Analytics: Predictive analytics involves the use of data to make predictions about future events or outcomes. It is used to forecast trends, identify opportunities and risks, and make informed decisions.
Prescriptive Analytics: Prescriptive analytics involves the use of data to recommend the best course of action based on the insights obtained from data. It is used to optimize processes, improve efficiency and make informed decisions.
Data analytics is used in a wide range of industries, including finance, healthcare, marketing, retail, and manufacturing, among others. It is also used for various purposes, such as customer segmentation, fraud detection, risk management, and supply chain optimization, among others.
Customer churn: Analysis of customer behavior and demographics
E-commerce: E-commerce companies use data analytics to optimize their sales and marketing strategies.
Healthcare: Healthcare companies use data analytics to improve patient outcomes and reduce costs.
Finance: Financial institutions use data analytics to manage risk and identify fraud.
Manufacturing: Manufacturing companies use data analytics to optimize their production processes and reduce costs.
Sports: Sports teams and organizations use data analytics to gain a competitive edge over others.
We @EduPlusOne teach, practice & follow python a powerful platform for data analytics, with numerous libraries and tools designed for the same.
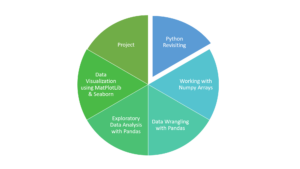
Python Revisited
Python Basics, Data Structures, String Operations, Programming Fundamentals ( Iteration-loops and Conditional Constructs) Libraries, List/Tuples, Dictionary, Sets and Loading and saving data in text files.
Working with Numpy Arrays
Intro to Scientific Computing, Working with n-dimensional Arrays, Performing Statistical, Set, Sorting Operations, Numpy Broadcasting
Data wrangling & Exploratory Data Analysis (EDA) in Python using Pandas
Working with Data Frames, Data Ingestion, Data Cleaning, Data Visualization with Pandas
Data Visualization using Matplotlib & Seaborn Libraries
Intro to Data Visualization, Plotting Datasets using matplotlib & Seaborn library, Interactive Visualization of World Data
Working on real life industry based Projects
Health care / Banking / Telecom/ Retail & Food Industry Projects
Course Duration
10 Weeks
Course Fees
INR 18,000 (Python+DA)
